
Trend Forecaster v3.00 Released: Auto-Tune Sensitivity, Smarter Market Stats and Free Bonus Add-ons
Contents
- 1 What’s New:
- 2 Trend Forecaster 3.00: Automatic Sensitivity Tuning Is Here
- 3 How It Works (in Video)
- 4 New Features Overview
- 5 One of the Possible Workflows
- 6 Better Extended Info Panel
- 7 Improved External Buffer Access
- 8 Improved Visual and Performance Experience
- 9 🎁 Updated Trend Forecaster Dashboard as a Bonus
- 10 Important note about Strategy Tester
- 11 Final Conclusion
- 12 🎁 One More Bonus Is Coming
Today we want to share an important update for Trend Forecaster. Version 3.00 focuses on one practical goal: making the indicator easier to adapt to different markets. With the new Auto-Tune Sensitivity mode, improved statistics and updated workflow, traders can spend less time adjusting settings and more time analyzing real market opportunities.

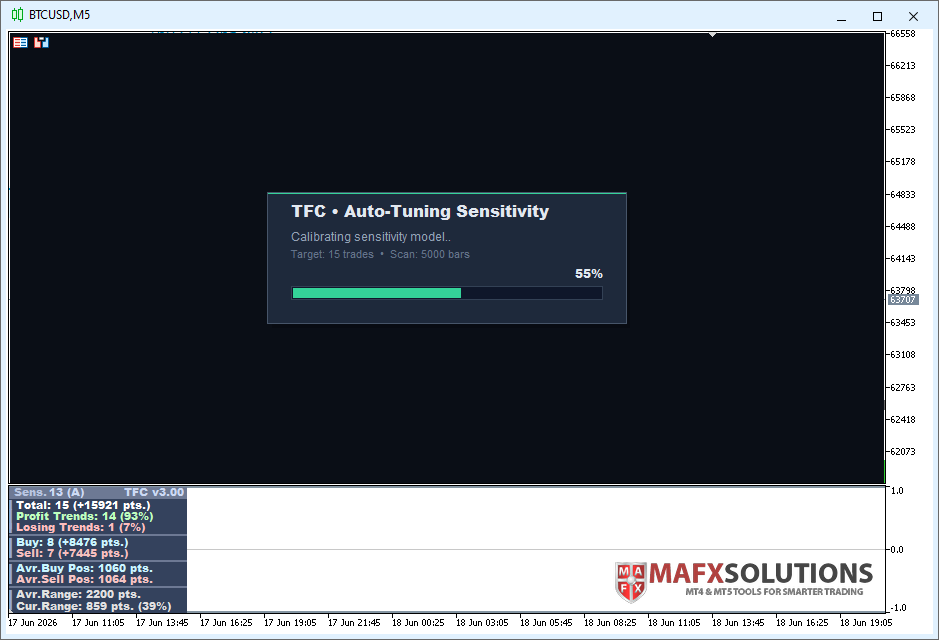
Trend Forecaster v3.00 brings automatic Sensitivity tuning.
The indicator can now analyze recent market history and calibrate itself for the selected symbol and timeframe. This helps reduce manual setup and makes the first launch faster on different instruments.
![]()
Trend Forecaster (TFC) + Trend Forecaster Dashboard (TFC Dashboard)
Product URL: Trend Forecaster + Dashboard as a Bonus
Testimonials: Read More…
Current Version: v3.00
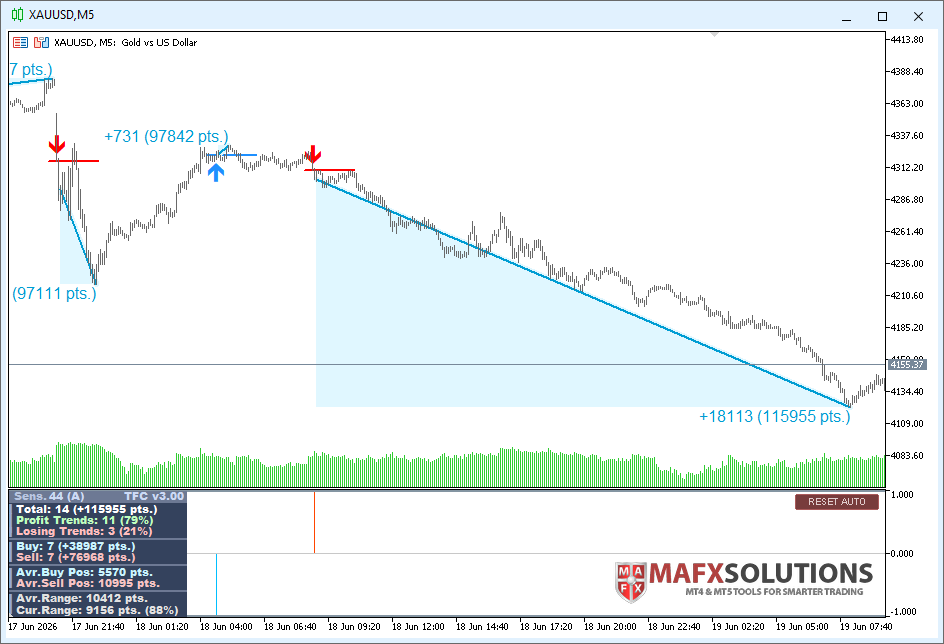
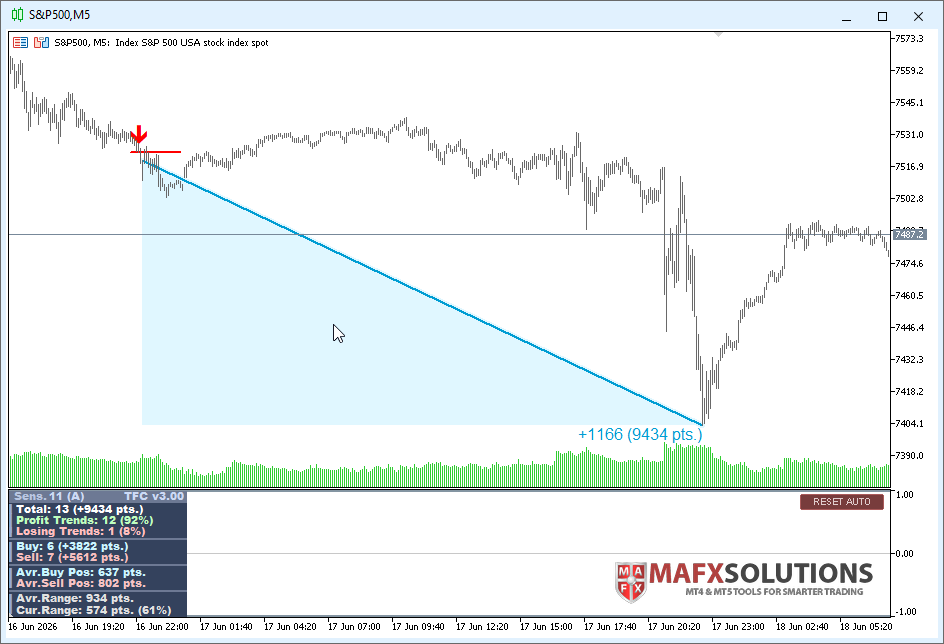
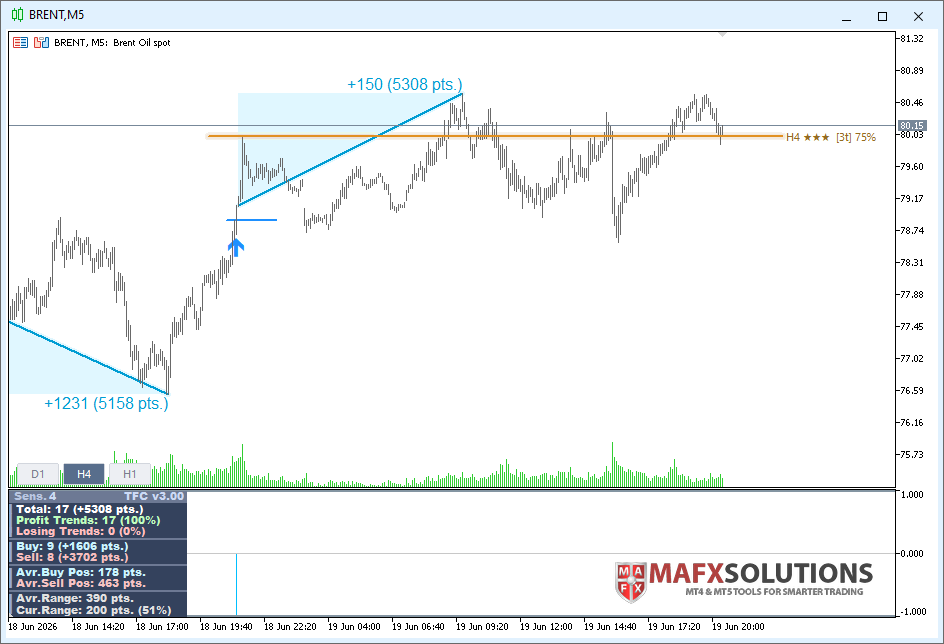
Description: Trend Forecaster is a MetaTrader 5 indicator that combines breakout signals, possible reversal area analysis, market range data and a visual statistics panel in one chart workspace. It shows Buy and Sell signals, tracks Average Range and Current Range, and can automatically adjust Sensitivity for the current symbol and timeframe. Manual Sensitivity control is also available. The indicator can be used on Forex pairs, metals, stocks, indices and cryptocurrencies. Different timeframes are supported, with M5 as a practical starting point.
Trading Instruments: Any
Working Time Frame: Any, but M5 recommended
Trading Platform: MetaTrader 5
What’s New:
✅ Major update: added Auto-Tune mode for automatic Sensitivity calibration✅ Removed the old Scale Mode input. Sensitivity is now the main manual control for signal filtering
✅ The indicator can now select Sensitivity for the current symbol and timeframe using recent price history
✅ Added Target Trades setting to control the desired number of historical signals during Auto-Tune
✅ Added saving of Auto Sensitivity values separately for each symbol and timeframe
✅ Added RESET AUTO button to clear the saved Auto-Tune value and start a new calibration
✅ Improved history loading logic before automatic tuning
✅ Added optional retuning after full historical data load
✅ Added Auto-Tune status panel with current calibration progress
✅ Improved Extended panel with Avr.Range and Cur.Range values
✅ Added Avr.Range and Cur.Range data buffers
✅ Improved Buy Signal and Sell Signal buffers for Expert Advisor integration
✅ Improved statistics calculation and performance
✅ Added Arctic and Midnight visual themes
✅ Auto-Tune is not used in Strategy Tester. Manual Sensitivity is used there for predictable testing.
Trend Forecaster 3.00: Automatic Sensitivity Tuning Is Here
Trend Forecaster 3.00 is a major update focused on one simple idea: the indicator should adapt to the market faster and require less manual setup.
Now Trend Forecaster can automatically tune Sensitivity for the current symbol and timeframe. You only set the target number of trades on history. The indicator analyzes price action, checks signal frequency and selects a suitable Sensitivity value.
How It Works (in Video)
After extensive testing, I found a practical signal-to-noise balance for Trend Forecaster. On M5, a good starting point is about 15 signals per 5000 calculated bars.
This makes the setup process much easier, especially when you test multiple symbols or switch between Forex, Gold, indices and crypto.
New Features Overview
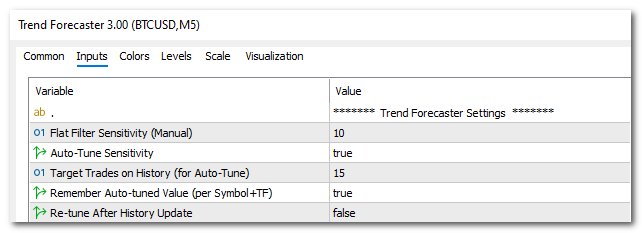
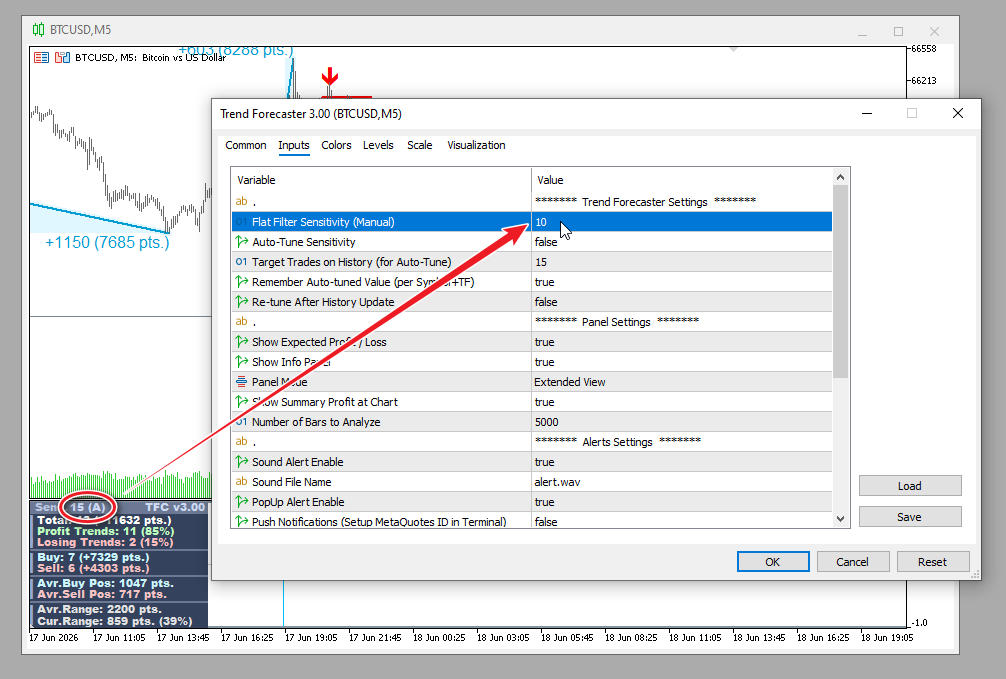
Target Trades on History (for Auto-Tune)
A new ‘Target Trades on History (for Auto-Tune)’ setting defines how many trades the indicator should aim to find on the selected historical window.
This keeps the logic simple:
• Too many signals means the filtering is too soft.
• Too few signals means the filtering is too strict.
• The target helps find a balanced Sensitivity value.
The default idea for M5 is around 15 trades per 5000 bars, but you can adjust it to match your trading style.
Remember Auto-Tuned Value (per Symbol+TF)
Once Trend Forecaster finds a suitable value, it can cache it for the current symbol and timeframe. This means you do not need to wait for a new tuning process every time you reload the chart. The indicator can use the cached value and start faster.

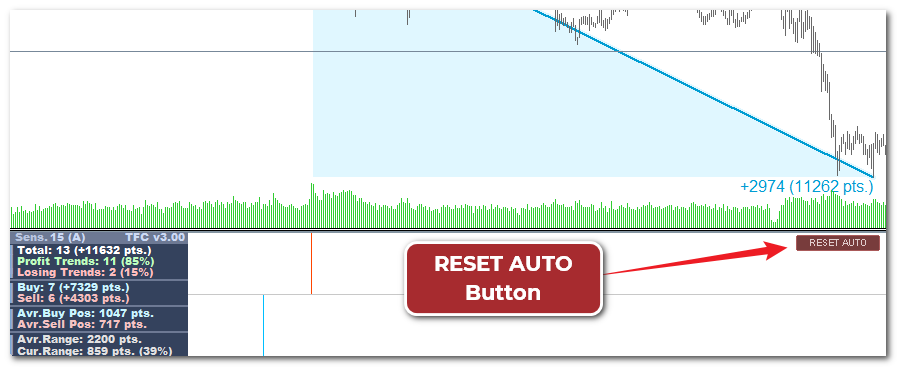
RESET AUTO Button
Market conditions change. Your trading approach can also change.
That is why version 3.00 includes a RESET AUTO button. It clears the saved value for the current symbol and timeframe and starts the tuning process again.
This is useful after changing:
• symbol
• timeframe
• amount of history
• preferred signal frequency
• market conditions
Re-tune After History Update
If enabled, the indicator will automatically run the tuning process again after the available historical data is updated. This helps keep the selected sensitivity aligned with the latest history.
If disabled, the current tuned value remains unchanged.
One of the Possible Workflows
1. Attach the indicator to the chart with the required symbol and timeframe
2. Set ‘Auto-Tune Sensitivity’ to true
3. The indicator will automatically find the suitable Flat Filter Sensitivity level according to the ‘Target Trades on History (for Auto-Tune)’ setting
4. Once the value is found, you can set ‘Auto-Tune Sensitivity’ to false and copy the detected value into ‘Flat Filter Sensitivity (Manual)’
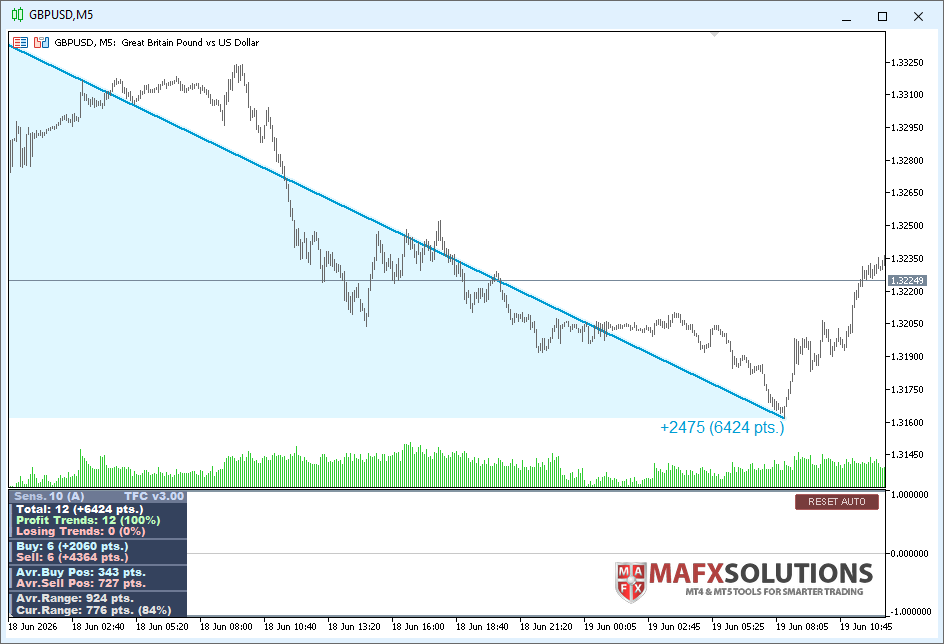
Better Extended Info Panel
The Extended panel now gives a clearer view of market potential.
It shows:
• total detected trends
• profit and losing trend ratio
• Buy and Sell statistics
• average Buy and Sell movement
• average daily range
• current daily range
• current range percentage compared with average range
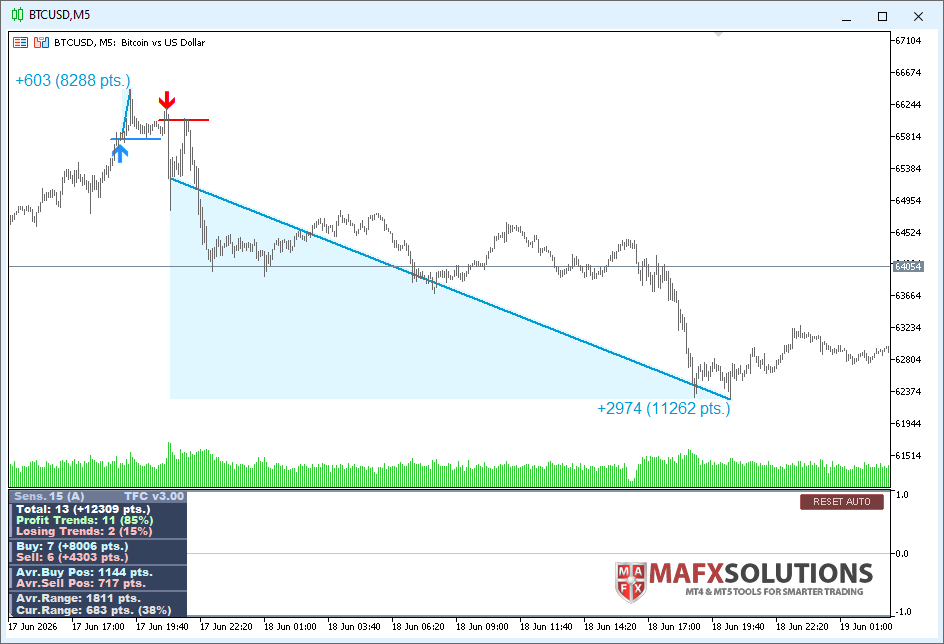
The Cur.Range value is especially useful for intraday trading. If the current daily range is already close to or above the average range, the remaining potential may be limited.
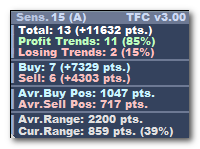
For example, if the average daily range is 2200 points and the indicator currently shows 859 points, it means the market has covered only part of its usual range, about 39%. In this case, there may still be room for further movement.
But if Cur.Range is already close to the average daily range or even above it, then most of the day’s potential move may already be used up. In that situation, expecting a strong continuation becomes less reasonable.
Improved External Buffer Access
Trend Forecaster v3.00 also improves the structure for external use.
Buy and Sell signal buffers are now clearly defined. Additional range data is available as well. This helps traders and developers who use Trend Forecaster signals in custom tools, dashboards or Expert Advisors.
Buffer 0: Buy Signal
Buffer 1: Sell Signal
Buffer 2: Average Range
Buffer 3: Current Range
For example:
handle = iCustom(_Symbol, _Period, InpIndicatorPath,
                 "",                  // empty string
                 InpSensitivity,      // Flat Filter Sensitivity
                 false,               // Auto-Tune Sensitivity (set false for EA)
                 15,                  // Target Trades
                 false,               // Remember Auto-Tuned Value (set false for EA)
                 false                // Re-tune After History Update (set false for EA)
                );
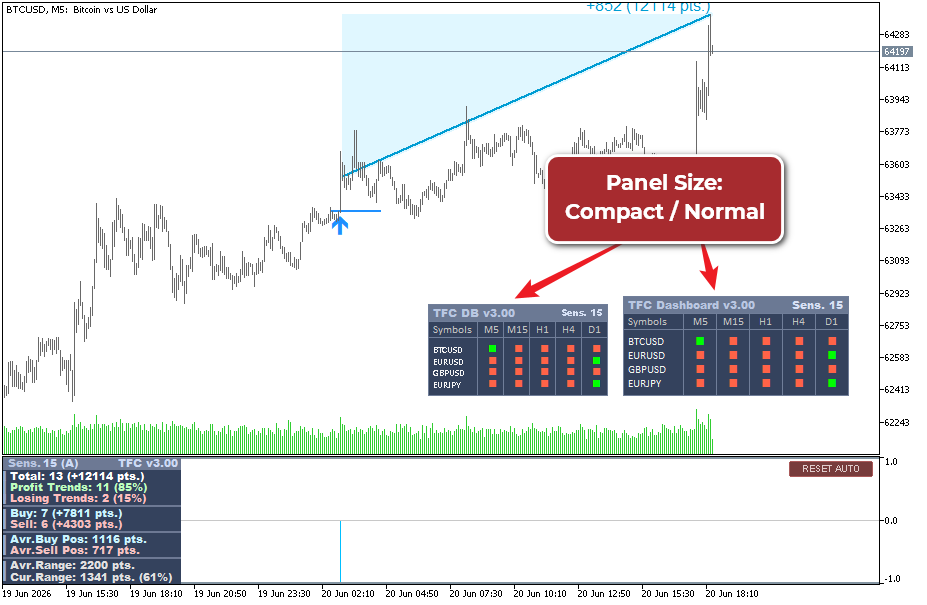
Improved Visual and Performance Experience
The indicator now handles heavy calculations more efficiently.
The visual side has also been improved.
Version 3.00 includes better scaling, cleaner service panels, improved status messages and additional color themes: Arctic and Midnight.
🎁 Updated Trend Forecaster Dashboard as a Bonus
Trend Forecaster Dashboard remains available as a bonus for Trend Forecaster buyers.
The Dashboard helps you analyze multiple symbols and timeframes from one panel. It is especially useful when you want to confirm a signal from the main Trend Forecaster indicator with higher timeframe direction.
With version 3.00, the Dashboard has also been improved to match the updated workflow and make market scanning easier.
Important note about Strategy Tester
‘Auto-Tune Sensitivity’ variable is designed for live charts.
In Strategy Tester, Trend Forecaster uses the ‘Flat Filter Sensitivity (Manual)’ value. This avoids confusion and keeps testing behavior predictable.
If you want to test a specific setup, set Sensitivity manually before running the test.
Final Conclusion
Trend Forecaster v3.00 is not just a visual update.
This version changes the setup process and makes the indicator easier to adapt to different symbols, timeframes and market types.
Auto-Tune helps find a practical Sensitivity value based on recent history. The updated panels make market context easier to read. The improved Dashboard workflow helps check several symbols and timeframes from one place.
The core idea of Trend Forecaster stays the same: breakout signals, trend direction and practical market statistics in one tool.
The goal is simple: spend less time guessing settings and more time analyzing real market opportunities.
🎁 One More Bonus Is Coming
I am also preparing an extra bonus for Trend Forecaster buyers: a Lite version of my own Levels indicator, designed to highlight key market levels and make chart analysis easier.
The idea is to add another layer of analysis after a Trend Forecaster signal appears. Trend Forecaster helps identify breakout and trend signals. The Levels tool will help analyze important price areas and possible profit-taking zones.
I have used level-based analysis in my own trading for a long time. The difficult part was building an indicator that works the way I need it to work. With MT5, I can finally implement several ideas that were difficult to build properly in MT4.
The Lite version of the Levels indicator will be available as a free bonus for Trend Forecaster buyers and loyal users.
More details will be published in the next update news.
Coming soon…